Guest post: Could the Atlantic Overturning Circulation ‘shut down’?

Guest Authors
02.11.20
Guest Authors
11.02.2020 | 8:00amGenerally, we think of climate change as a gradual process: the more greenhouse gases that humans emit, the more the climate will change. But are there any “points of no return” that commit us to irreversible change?
The “Atlantic Meridional Overturning Circulation”, known as “AMOC”, is one of the major current systems in the world’s oceans and plays a crucial role in regulating climate.
- Explainer: Nine ‘tipping points’ that could be triggered by climate change
- Guest post: Could the Atlantic Overturning Circulation ‘shut down’?
- Guest post: The irreversible emissions of a permafrost ‘tipping point’
- Guest post: Could climate change and deforestation spark Amazon ‘dieback’?
- Guest post: How close is the West Antarctic ice sheet to a ‘tipping point’?
It is driven by a delicate balance of ocean temperatures and salinity, which is at risk from being upset by a warming climate.
The latest research suggests that AMOC is very likely to weaken this century, but a collapse is very unlikely. However, scientists are some way from being able to define exactly how much warming might push AMOC past a tipping point.
Overturning
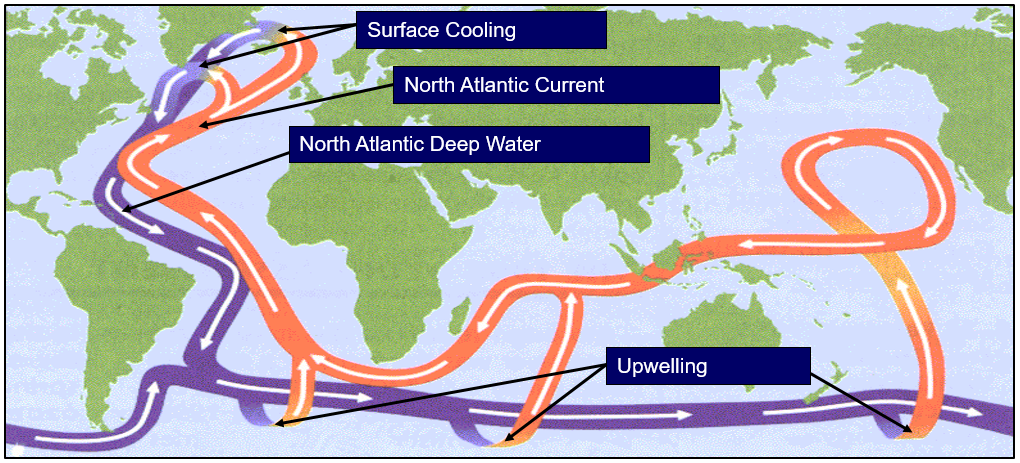
The figure below shows an illustration of the AMOC. In the North Atlantic, warm water from the subtropics travels northwards near the surface and cold – and, hence, more dense – water is travelling southwards at depth, typically 2–4km below the surface.
In the north, the warm surface water is cooled by the overlying atmosphere, converted to cold, dense water, and sinks to supply the deep, southward branch. Elsewhere, the cold water upwells and is warmed, re-supplying the upper, warm branch and completing the circuit.
Could the AMOC collapse?
The AMOC is vulnerable to climate change. As the atmosphere warms due to increasing greenhouse gases, the ability of the ocean to lose heat from the North Atlantic surface is diminished and one of the driving factors of the AMOC is weakened.
Climate-model projections of global warming this century consistently point to a weakening of the AMOC. The most recent assessments of the Intergovernmental Panel on Climate Change (IPCC) – the fifth assessment report (AR5) and special report on oceans and cryosphere in a changing climate (SROCC) – both conclude that the AMOC is “very likely” to weaken over the 21st century.
Such a weakening would have a cooling effect on climate around the North Atlantic region, as the northward heat supply is slowed down. This effect is included in the climate projections, but the direct warming effect from rising concentrations of greenhouse gases is stronger, so the net result is still warming over land regions.
But more dramatic changes are theoretically possible. A “tipping point” may exist beyond which the current strong AMOC becomes unsustainable.
Evidence for this goes back to a seminal paper published in 1961 by one of the fathers of modern oceanography, Henry Stommel. Stommel realised that the AMOC is a kind of competition between the effects of temperature and salinity, both of which influence the density of seawater.
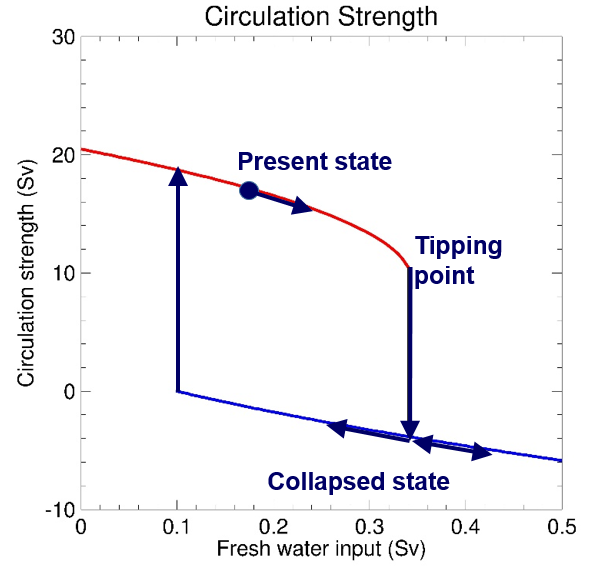
The figure below illustrates the different possible AMOC states. In today’s climate, temperature dominates and the cold, dense high latitude water drives a strong AMOC (red curve). But in other climate states it is possible for fresh water (from rainfall or ice melt) to freshen – and so lighten – the high-latitude water; in this case, the water is not dense enough to drive the AMOC, which collapses (blue curve).
If the freshwater input to the Atlantic were strong enough – from rapid melting of the Greenland ice sheet, for example – the blue dot would move to the right in the figure. According to Stommel’s model, at some point the strong AMOC state (red) becomes unsustainable and the AMOC collapses to the “off” state (blue). Then, even if the driving climate change were later reversed (the blue dot moving back to the left on the figure), the AMOC would stay on the blue curve and would not switch back on again until the climate had overshot the present day conditions in the opposite direction. This phenomenon is known as “hysteresis”.
Long-term projections
Stommel’s idea has evolved over the years, but the fundamental insight is still relevant. There is evidence that AMOC changes may have played a role in some major climate shifts of the past – most recently around 8,200 years ago as the world was emerging from the last ice age.
At that time, a huge lake in northwest Canada was being held back by an ice wall. As temperatures warmed the ice wall collapsed, depositing the fresh water from the lake into the North Atlantic and interrupting the AMOC. A major cooling at this time can be seen in palaeoclimatic records across North America, Greenland and Europe.
Comprehensive climate models generally do not project a complete shutdown of the AMOC in the 21st century, but recently models have been run further into the future. Under scenarios of continued high greenhouse gas concentrations, a number of models project an effective AMOC shutdown by 2300.
Model projections of the future AMOC do range widely, though. As a result, on the question of what level of global warming would result in an AMOC shutdown, it is unlikely that the scientific community will see any convergence in the near future.
While the fundamental mechanism that destabilises the AMOC in Stommel’s original model appears to be important in climate models, there are other processes that are trying to stabilise the AMOC. Many of these processes are difficult to model quantitatively, especially with the limited resolution that is possible with current computing power. So our AMOC projections will continue to be subject to quite some uncertainty for some time to come.
Taking all the evidence into account, the IPCC’s AR5 and SROCC concluded that an AMOC collapse before 2100 was “very unlikely” (pdf). However, the impacts of passing an AMOC tipping point would be huge, so it is best viewed as a “low probability, high impact” scenario.
What would be the impacts of a collapse?
Climate models can be used to assess the impact on climate if the AMOC were to shut down completely. By adding large amounts of fresh water to the North Atlantic in a model, scientists artificially lighten the cold, dense water that forms the lower branch of the loop. This stops the AMOC and we can then look at the impact on climate.
The figure below illustrates the changes that result in one such experiment. Shutdown of the AMOC results in a cooling (blue shading) of the whole northern hemisphere, particularly the regions closest to the zone of North Atlantic heat loss (the “radiator” of the North Atlantic central heating system). In these regions the cooling exceeds the projected warming due to greenhouse gases, so a complete shutdown in the 21st century, while very unlikely, could result in a net cooling in regions such as western Europe.
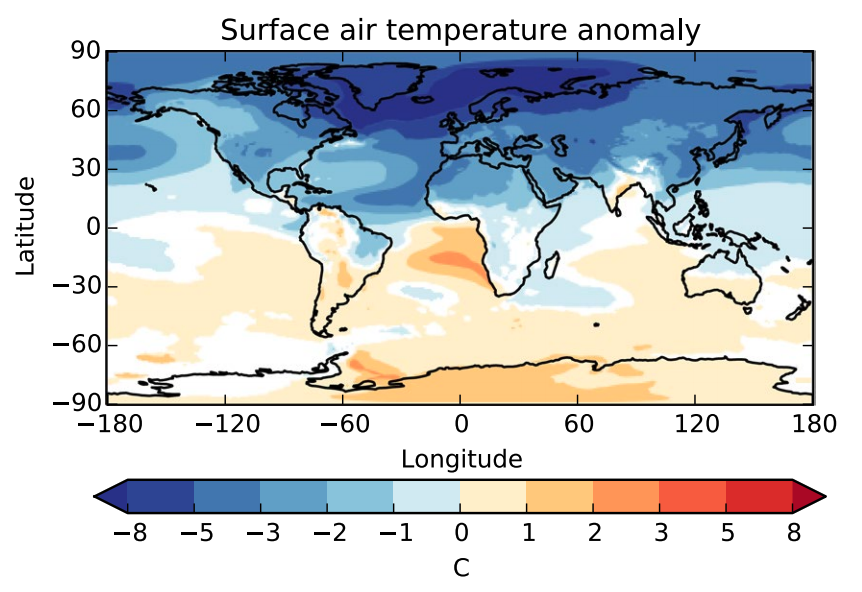
Other impacts include major shifts in rainfall patterns, increases in winter storms over Europe and a sea level rise of up to 50cm around the North Atlantic basin. In many regions these effects would exacerbate the trends due to global warming.
While such model experiments are artificial “what if?” scenarios, they illustrate the magnitude of the changes that could result from an AMOC collapse. The impacts on agriculture, wildlife, transport, energy demand and coastal infrastructure would be complex, but we can be certain that there would be major socioeconomic consequences. For example, one study showed a 50% reduction in grass productivity in major grazing regions of the western UK and Ireland.
What can be done about the risk of a collapse?
As explained above, scientists are some way from being able to confidently define a level of global warming at which the AMOC would be at risk of crossing a tipping point.
However, it may be possible to manage the risk of AMOC collapse, even without knowing how likely it is.
To take a domestic analogy: I know that it is possible, but unlikely, that my house will burn down – it is a low-probability, high-impact event. I don’t have much idea of how probable it is that I will have a fire, but I can manage the risk anyway by getting the electrical wiring checked and by installing smoke alarms. The wiring check reduces the chance of a fire, while the smoke alarm gives me early warning if a fire starts so that the impact can be reduced – by evacuating the house and calling the fire brigade.
Recently, along with colleagues at the University of Exeter, we have been exploring the possibility of developing an early-warning system for AMOC tipping.
Using a simple model, we have shown that the way the salinities of the subtropical and subpolar Atlantic evolve over time can give an early indication if the AMOC is on the path to a collapse, possibly decades before any major weakening has been seen in the AMOC itself.
It is early days for this research, but by monitoring such an indicator it may be possible to give more time to prepare for the consequences of an AMOC collapse, or to adopt more aggressive climate change mitigation measures to get the AMOC onto a more stable pathway.
Outstanding questions
As the world gets to grips with the challenges of meeting the targets of the Paris climate accord, interest is increasing in climate pathways that temporarily overshoot the final target level. It is important that such overshoots do not cross any irreversible thresholds on the way to the final destination, so research on tipping points needs to link theoretical results to these more practical questions.
Much of the modelling of AMOC tipping points to date has used idealised scenarios of freshwater input to the North Atlantic. This is relevant to some past AMOC changes, but to model future climate change we need to understand what happens when warming and freshening are taking place together.
This is a more challenging problem because the number of relevant processes and feedbacks is increased. Some of these processes operate at small scales that models struggle to resolve with current computing power. Improving the modelling of key AMOC processes needs patience and long-term commitment, but will eventually pay dividends in more confident AMOC predictions.
Research on early warning of AMOC collapse is in its infancy, but may be a fruitful way to respond to the risk. One thing is for sure: early warning will require continuous observations of key aspects of the AMOC.
AMOC monitoring entered a new era in 2004 with RAPID-MOCHA, an array of moored instruments that spans the width of the Atlantic at latitude 26.5 degrees north and provides continuous monitoring of the AMOC. Before this there had only been five snapshots of the circulation spread over 47 years.
Results have already changed our understanding of how the AMOC varies in time: for example, an unexpected dip in the AMOC – observed in Autumn 2009 – is thought to have played a role in the unusually cold European winters of 2009-10 and 2010-11.
More recently, a similar monitoring array has been installed further north in the subpolar Atlantic. Along with continuous measurements of temperature and salinity from drifting Argo floats, oceanographers now have an unprecedented database to study this crucial element of our climate system and give the world a chance to prepare for any nasty surprises.

