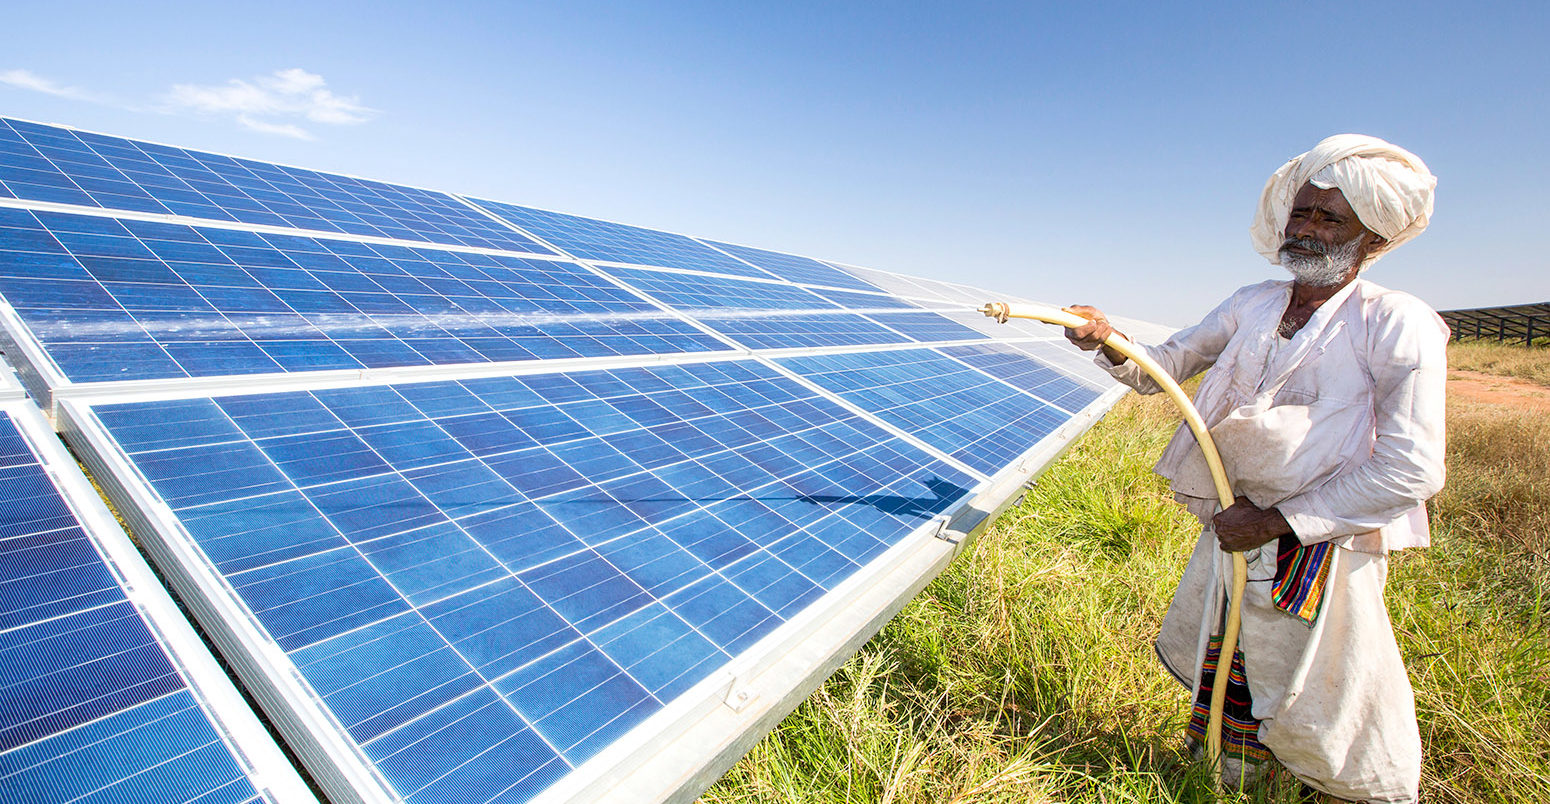
IEA: Renewables investment in India topped fossil fuels for first time in 2017
Jocelyn Timperley
07.17.18Jocelyn Timperley
17.07.2018 | 2:58pmInvestment in renewable power in India topped fossil fuels for the first time in 2017, according to the International Energy Agency (IEA).
This is one of the most striking insights contained within the IEA’s annual update of global energy investment, which was published today. It gives an overview of the global, regional and sectoral shifts in financing. For example, it shows that global energy investment fell by 2% in 2017, including a “worrying” decline for renewables.
Carbon Brief breaks down some of the key findings for 2017 from this year’s report, which include:
- 7% global fall in renewable power investment
- More than a million electric cars sold for first time
- Record high renewables investment in India
- 18% global decline in coal power plant investment
- Small rise in oil and gas supply spending
- 45% fall in nuclear power investment
- Continued decline in carbon capture and storage funding
Global fall
The IEA’s new World Energy Investment report, now in its third year, looks at energy investment around the world in 2017. It shows that global energy investment sat at $1.8tn in 2017, a 2% decline in real terms from the previous year. The chart below, from the report, shows the distribution of this investment and the changes from 2016.
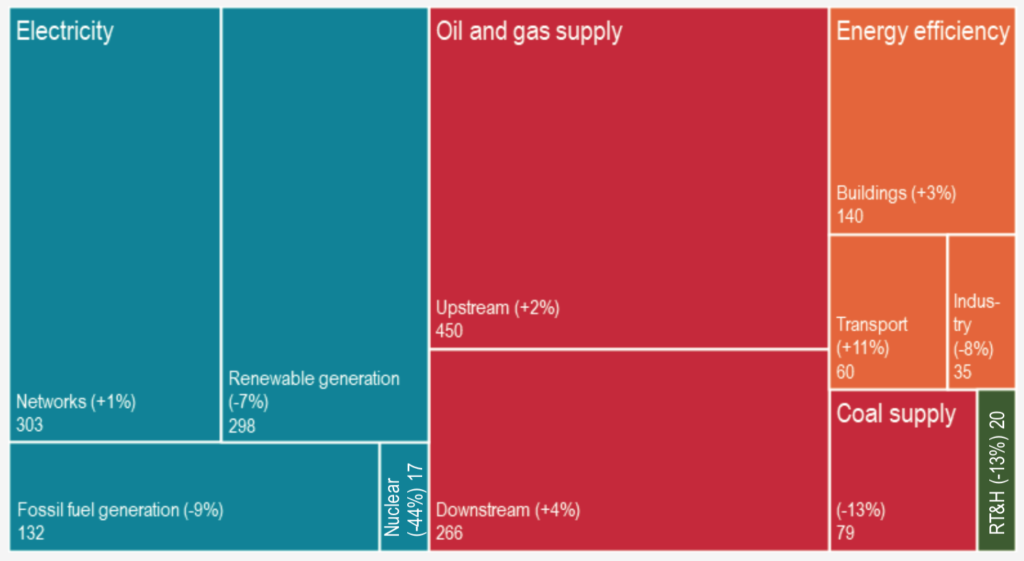
Global energy investment in 2017, by type, showing percent change from 2016. Upstream oil and gas supply covers extraction. Downstream covers processing and distribution. Source: IEA 2018.
As the chart shows, oil and gas supply investment increased in 2017. Reduced spending in coal supply and liquefied natural gas (LNG) offset a modest 4% rise for upstream oil and gas, the IEA says. This rise comes after heavy cuts in investment following the oil price crash in 2015. Meanwhile, investment in fossil-fired power generation fell.
Altogether, the power sector attracted the largest share of energy investments for the second year in a row, reflecting the move towards greater electrification in the energy sector, the IEA says. However, nuclear investment dropped by 44% to hit its lowest level in five years, while investment in renewable power dropped by 7%.
However, investment in renewables still sat at £298bn, accounting for two-thirds of power sector spending. Solar and offshore wind investment rose compared to 2016, but this was more than offset by a decline in onshore wind, hydro and solar thermal investment.
Speaking at a press briefing ahead of the report’s release, Simon Bennett, energy analyst at the IEA, said there has been progress in “working out the policies” that unlock investment into solar and offshore wind, but that similar improvement has not been seen for low-carbon transport and heat.
“Despite the growth of EVs, we’re not seeing an improvement in the investment landscape for either biofuels or solar thermal heating and these are sectors that [require a lot more attention] if we are going to keep on track for an overall energy system decarbonisation…
“[Buildings and transport] are in many cases harder to decarbonise and [climate goals] cannot fully be achieved just through electrification.”
The IEA also warns that recent policy changes in China aiming to promote more cost-effective solar “raise the risk” of a slowdown in investment in 2018. As China accounts for more than 40% of all investment in solar, this has global implications, the IEA says. China’s policy changes have led some analysts to lower forecasts for global installations this year, although it could also push down global solar prices and so raise installations rates elsewhere.
Energy efficiency showed some of the strongest expansion in 2017, the IEA says, rising 3% compared to 2016 to reach £236bn. This was not enough to offset the decline in renewables, however. Investment in energy efficiency is also closely linked to government policy – often through energy performance standards – where there are signs of slowing progress, the IEA says.
More than 95% of power sector investment is now based on regulation or contracts for remuneration, the IEA adds. There is, therefore, a dwindling role for new projects based solely on revenues from variable pricing in competitive wholesale markets, it says.
Million-plus EVs
Last year saw a 54% increase in electric vehicle (EV) sales, which topped one million for the first time, the IEA says. This meant EVs accounted for 1.3% of global vehicles sales, the IEA adds. Just over half of EVs sold last year were bought in China.
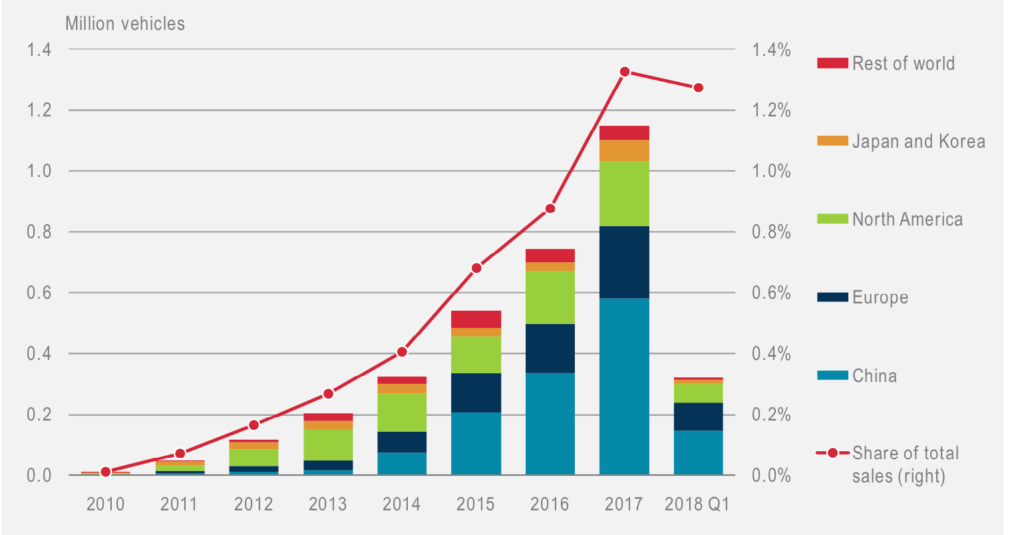
Electric car sales and market share. Figures include plug-in hybrids. Note that 2018 figures only includes the first three months of the year. Source: IEA 2018.
Notably, around a quarter of the $43bn spent on EVs in 2017 came from governments, who the IEA says are allocating more capital each year to support the sector. In addition, eight countries have announced bans on sales of internal combustion by 2040, while 19 cities have announced restrictions by or before 2040.
Sales of electric buses are also growing rapidly, the IEA notes, again driven by China. Public charging points now number 430,000, half in China.
EV battery costs have declined more quickly than most other emerging energy technologies, the IEA notes, with investment in battery manufacturing capacity rising more than fivefold since 2012.
Large investments to expand production capacity of lithium and cobalt are now required to avoid bottlenecks in the supply chain for lithium-ion batteries that could disrupt EV cost reductions, the IEA says.
This has already started in recent years: as the chart below shows, investment in lithium mining has risen almost tenfold since 2012. However, investment remains “tiny” compared with copper and coal, says the IEA.
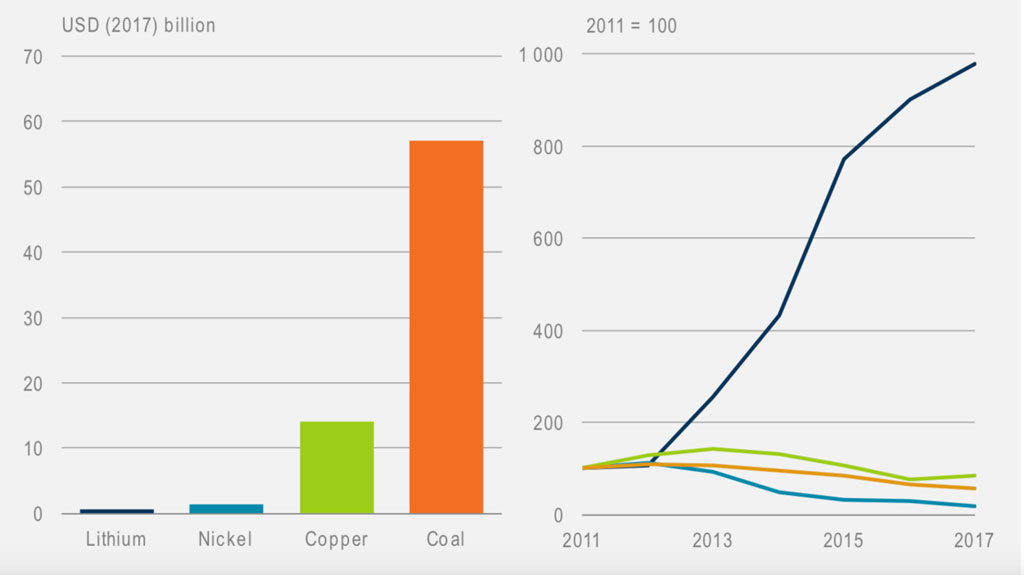
Global investment in mining of selected commodities, 2017 (left) and trend since 2011 (right). Source: IEA 2018.
In the longer term, global shortages of key commodities in the manufacture of batteries are unlikely, says the IEA.
“Future bottlenecks and volatility can be eased by policies that reduce uncertainty around future battery demand, encourage more recycling and help standardise cathode requirements.”
EVs are not the only rapidly growing technology with big implications for emissions: spending on heat pumps increased by 30% in 2017, the IEA says. The associated electrical load of heat pumps installed in 2017 exceeds that of all the electric cars sold in the same year, the IEA notes.
India crossover
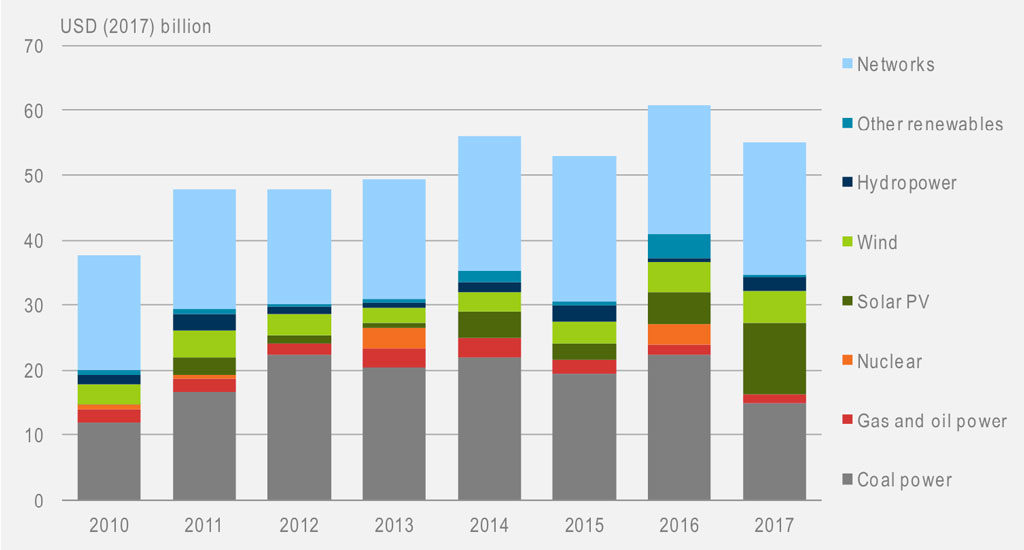
One of the most striking findings of this year’s report is that investment in renewable power (green and dark blue blocks in the chart, below) in India topped that for fossil fuel-based generation (grey and red blocks) for the first time last year.
Overall, power sector investment fell by nearly 10% in India, due to a significant reduction in coal spend. But renewable investment reached a record high of nearly $20bn, driven by a more than doubling of solar PV investment and record spending in onshore wind projects. Spending on grids also remained at “historical highs”, says the IEA.
The IEA adds that supportive policies and tendering of larger renewable energy lots in India is helping investors take advantage of economies of scale. “Since 2014, the size of sanctioned solar PV has grown over threefold and wind has grown nearly fivefold,” it notes. For example, the government of India recently announced plans to tender for 100 gigawatts (GW) of new solar capacity. The country has a target to install 175GW by 2022.
Coal slump
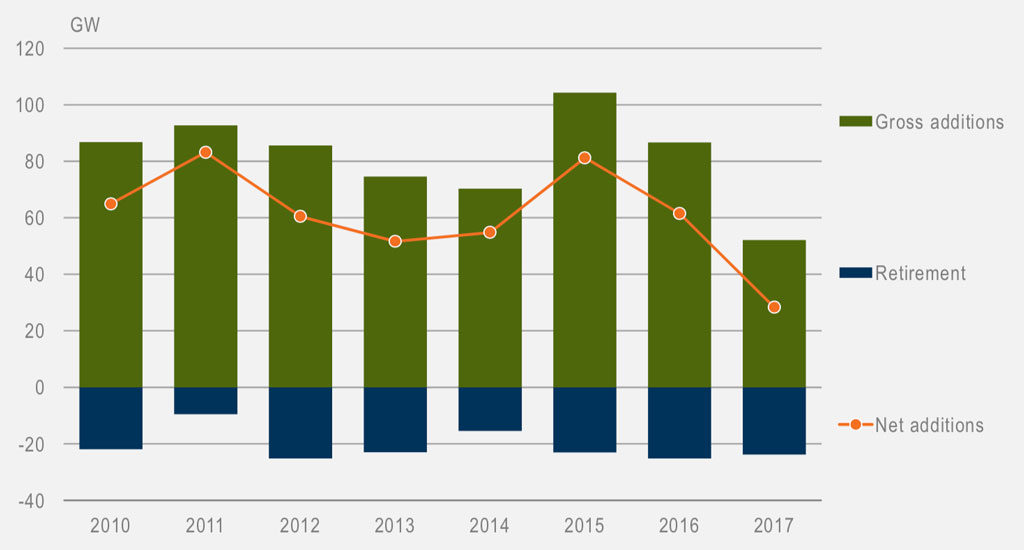
The global coal fleet continued to expand in 2017 (orange line in the chart, below), mostly due to markets in Asia. However, falling global capacity additions (green columns) and a higher level of retirements of existing plants (blue columns) meant net additions of coal-fired plants fell by over 50% in 2017, the IEA says.
This trend matches the one highlighted in Carbon Brief’s recent map showing all the coal plants in the world in each year between 2000 and 2017.
In last year’s report, the IEA projected investment in coal plants was set to decline “dramatically” after passing an all-time high in the previous few years. Its report this year shows final investment decisions for coal power plants fell by 18% in 2017, to just a third of their 2010 levels.
One important point made by the IEA, however, is that over half of the world’s coal power capacity is in countries where the average plant age is less than 11 years old. “Much of [this] is in China,” it adds, “where retrofitting with carbon capture [and storage, CCS] could significantly reduce national CO2 emissions.”
Investment in new coal-fired plants in China dropped by 55% in 2017, however. China’s position as the largest destination of all energy investment, taking over one-fifth of the global total, makes this particularly significant.
Reduced spending in coal mining in China is also largely behind the 13% fall in coal supply investment 2017, to just below $80bn, the IEA says. This comes despite a more-than-doubling of thermal coal prices since early 2016. Last year was the fifth consecutive year of falling coal supply investment in China, following a decade of continuous growth, the IEA says. It adds:
“The threat of tougher policy action to address climate change and air pollution and enhanced competition from renewables continue to discourage investment in coal.”
Oil and gas spending
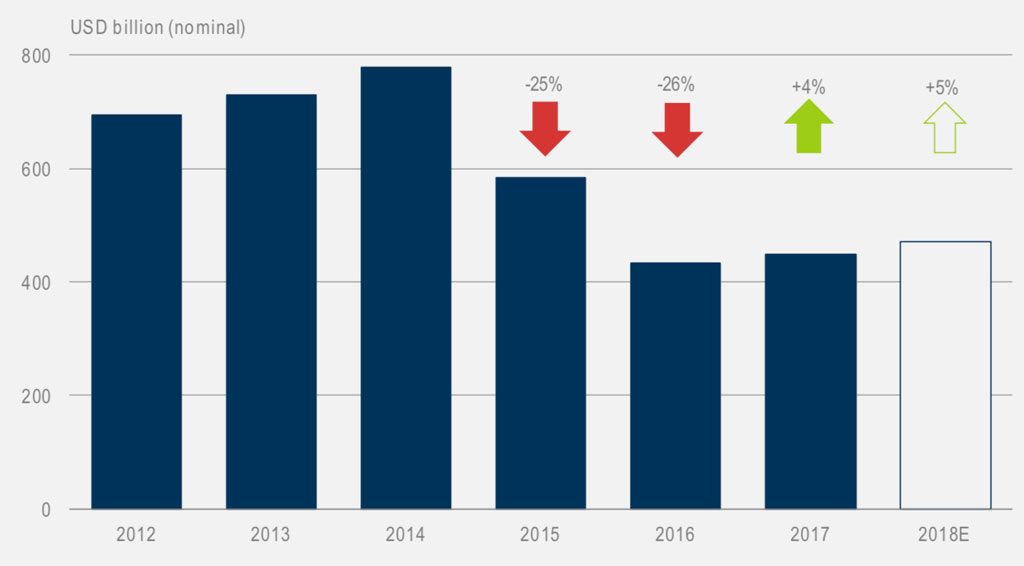
As the chart below shows, 2017 saw a modest 4% rise in spending in oil and gas supply, after investment had roughly halved in the previous two years. This increase was driven by the US shale industry, the IEA says.
This increase for oil and gas supply means fossil fuels accounted for a rising share of global energy investment for the first time since 2014, the IEA says. That share now sits at 59%. The IEA expects it to fall to 40% by 2030, but adds that “current investment patterns suggest a still-significant role for fossil fuels in coming years”.
Nuclear slowdown
Another striking finding from the IEA is that investment in nuclear power nearly halved in 2017, falling by 45% to its lowest level in five years as fewer new plants came online. This is shown in the chart, below, with a sharp fall in investment in new nuclear capacity (dark blue columns, below left) partly offset by rising spend on keeping old plants open (light blue).
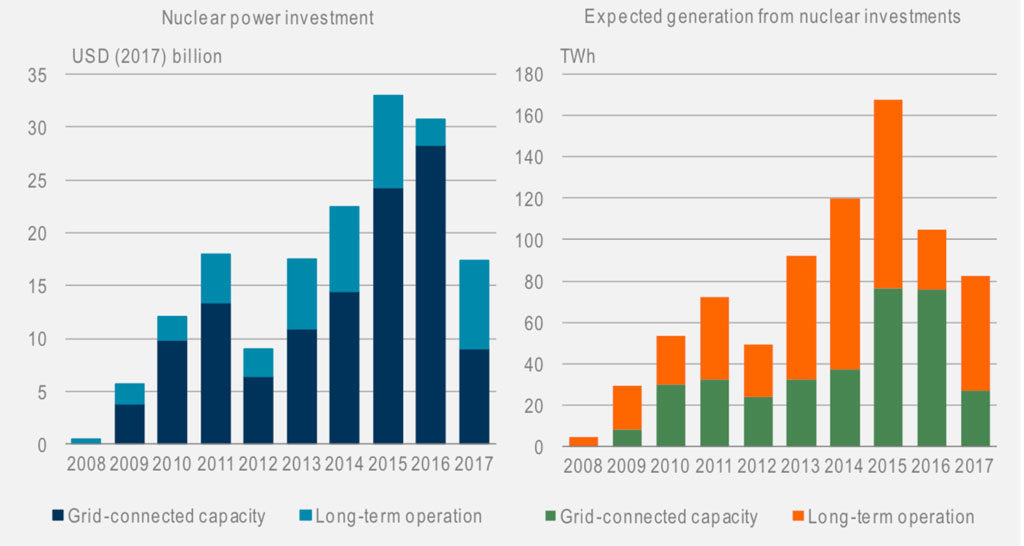
Global nuclear power investment and expected generation from new (dark blue, left and green, right) and existing plants (light blue, left and orange, right). Source: IEA 2018.
Over 5 gigawatts (GW) of nuclear plants were retired in 2017, compared to new construction starts of only around 3GW, leading to a net reduction of about 2 GW in total nuclear capacity worldwide. Capacity was still around 10 GW higher than in 2007 though, the IEA says.
Of the nuclear investment that remains, a growing share is going to upgrades of existing reactors, which now represent around half of total nuclear investment. This means the fall in spending on new plants is actually closer to 70%, the IEA says. In some regions, it adds, retirements of existing plants are offsetting the emissions benefits of new renewables.
Carbon capture
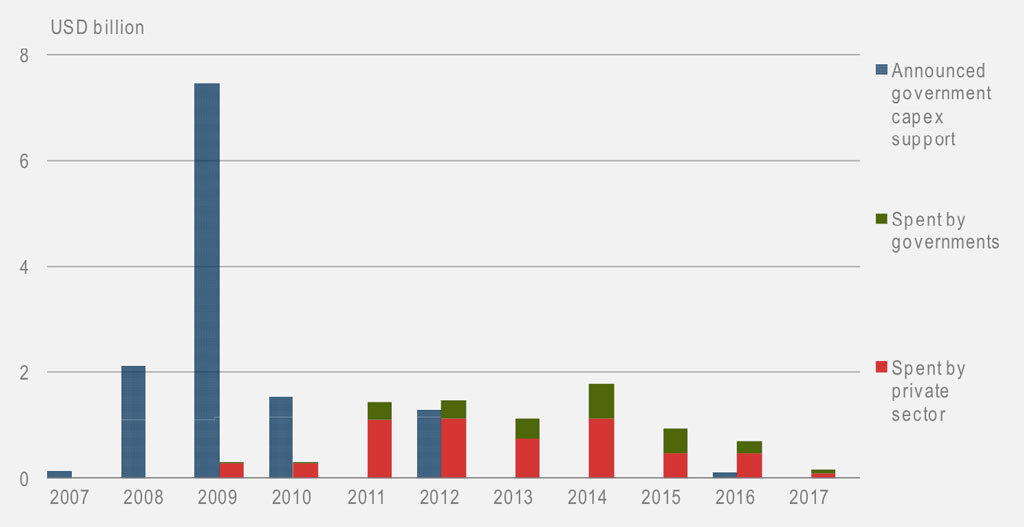
As the IEA chart below shows, investment in large-scale carbon capture, utilisation and storage (CCUS) projects has declined markedly in recent years.
Government funding commitments for new projects, which peaked in 2009, have now “dried up”, the IEA says.
Bennet said at the press briefing that only around 15% of the $28bn earmarked for large CCUS projects since 2007 has actually been spent. Most of the remainder of public funding has been reabsorbed by government budgets unspent, the IEA says.
New approaches to boosting investment in CCUS are now needed for the world to be on track to meet its climate change goals, the report says. It adds:
“Dedicated commercial incentive as low as $50 per tonne of CO2 sequestered could trigger investment in the capture, utilisation and storage of over 450 million tonnes of CO2 globally in the near term.”
-
IEA: Renewables investment in India topped fossil fuels for first time in 2017
-
IEA: Global energy investment falls 2% in 2017


