Climate sensitivity is unlikely to be less than 2C, say scientists
Roz Pidcock
04.01.15Roz Pidcock
01.04.2015 | 12:15pmDoes the fact that surface temperatures are rising slower than in previous decades mean scientists have overestimated how sensitive the Earth’s climate is to greenhouse gases?
It’s a question that’s popped up in the media from time to time. And the short answer is probably no, according to a new paper in Nature Climate Change.
Using temperature data up to 2011, the authors work out a value of climate sensitivity of 2.5C, comfortably within the range where scientists have suggested the ‘real’ value lies.
Questions about climate sensitivity are complicated, and won’t be solved by any single bit of research. But the new paper seems to contribute to a growing confidence among scientists that climate sensitivity is unlikely to be less than 2C.
A lower limit
Equilibrium climate sensitivity (ECS) is the warming we can expect per doubling of atmospheric carbon dioxide above pre-industrial levels. In 2013, the Intergovernmental Panel on Climate Change (IPCC) estimated the value is likely to lie between 1.5 and 4.5C. This marked a change from previous reports, which put the lower boundary at 2C.
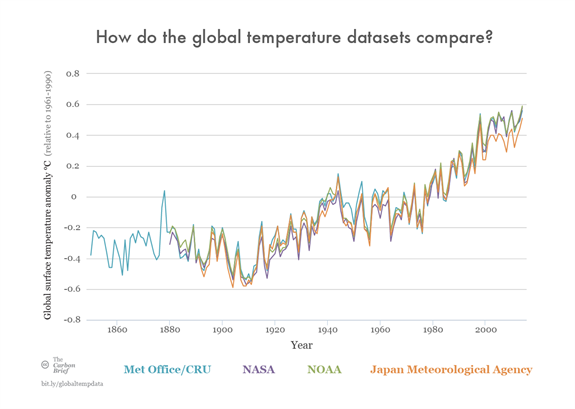
The new paper says lowering of the limit was partly “an effect of considering observations over the warming hiatus”. This refers to the last 15 years or so in which surface temperatures have risen slower than in past decades, even though we’re emitting greenhouse gases faster.

Global average surface temperature since 1860 from the four main temperature records. Source: Rosamund Pearce, Carbon Brief.
So what, if any, impact has the so-called surface warming slowdown had on climate sensitivity?
Energy budgets
The new paper uses what’s called an energy balance model to compare observations of how much the land, ocean, ice and atmosphere have warmed over the industrial period to how greenhouse gases and other factors that influence temperature, known as forcings, have changed in that time. This is one of several different ways to work out climate sensitivity.
Using temperature data beginning in 1765 and ending in 2011, the new paper calculates a climate sensitivity of between 2 to 3.2C, with a most likely value of 2.5C.
The authors looked at the effect of taking out some of the data, a decade at a time. When the authors removed temperatures after 2001, they found the most likely value of climate sensitivity rose slightly to 2.8C, and the uncertainty range broadened slightly.
The reason for the difference could be that the model isn’t capturing the full extent of warming. Research suggests natural cycles in the Pacific are redistributing heat, temporarily pushing more into the deep ocean between 700 and 2,000 metres, rather than keeping it at the surface.
While the new model looks for heat in the ocean down to 2,000 metres using data from ARGO floats, this may still miss some of the warming taking place.

Source: Rosamund Pearce, Carbon Brief
Or there might be another explanation why climate sensitivity is lower using this method when you include data from the last decade, say the authors. Uncertainty tends to narrow as more temperature data becomes available to plug into the model, though not in a predictable way.
It’s too soon to tell which of these factors is the bigger contributor, lead author Professor Daniel Johansson from Chalmers University in Sweden, tells Carbon Brief:
“We find a more constrained [range] of the ECS when using observations up to 2011 compared to when using observations up to 2001 … [but] we cannot disentangle the exact mechanisms.”
That the new paper extends to 2,000 metres in the ocean explains why climate sensitivity is higher than those from other energy budget studies.
For example, a paper by Otto et al. in 2013 proposed a best estimate for equilibrium climate sensitivity of 1.9C. Other estimates by Aldrin et al. (2012)., Lewis (2013) and Lewis and Curry (2014) have come in lower still, at around 1.6C. The energy balance models in those studies tend to stop at 700 metres in the ocean, Johansson explains:
“[O]ur approach is more complete in the sense that we capture a larger fraction of the energy taken up by the oceans.”
[Nic Lewis has left a comment below pointing out that Otto et al. (2013), Lewis (2013) and Lewis & Curry (2014) do consider ocean heat content below 700m. Johansson has since clarified that his comments refer to other energy balance model studies, such as Aldrin et al. (2012), Skeie et al., (2014) and Huber et al., (2014)].
A combination of these lower estimates from energy balance models, and the fact that scientists’ estimate of the total human influence on climate has increased in recent years, caused the IPCC to lower the lower boundary on climate sensitivity in the last report.
Adding up feedbacks
But there’s a growing realisation in the scientific community that energy balance models may be oversimplified, says Gabriel Hegerl, professor of climate system science at the University of Edinburgh. Insights gained since the IPCC’s most recent report have led scientists to “query the simple model based estimates”, she tells Carbon Brief.
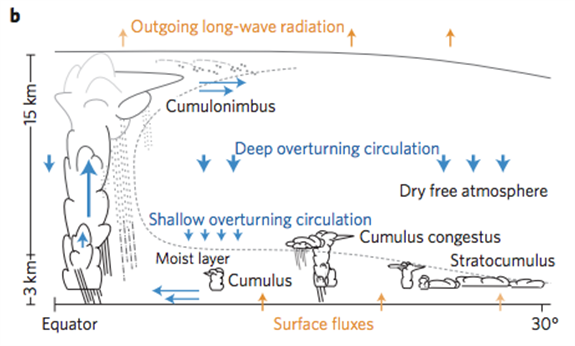
Schematic of the complex relationship between atmopsheric circulation and cloud feedbacks, and the impact on climate. Source: Bony et al., (2015).
An alternative approach to estimating climate sensitivity is to use climate models. These work out the temperature rise expected from greenhouse gases and all processes in the climate system known to amplify or dampen the speed of warming, known as feedbacks.
These include the rise in water vapour, itself a greenhouse gas, and the loss of reflective Arctic sea ice. When you take into account all these feedbacks, you get a climate sensitivity that’s more than 2C, explains Professor Reto Knutti, head of climate physics at the Swiss Federal Institute of Technology in Zurich.
Knutti tells Carbon Brief that the rise in water vapour and the change in temperature between different layers of the atmosphere – known as the lapse rate feedback – essentially doubles the amount of warming we can expect from greenhouse gases alone, without any other feedbacks.
Add in the extra warming arising from the loss of ice, and that takes climate sensitivity up to about 2C. Knutti continues:
“Then it comes down to cloud feedbacks, and those are likely (maybe very likely) positive, which definitely puts us above 2C”.
Scientists gathered at a conference in Ringberg in Germany last week dedicated to discussing cloud feedbacks and climate sensitivity. Dr Andrew Dessler, an expert in water vapour and climate change at Texas A&M University, who attended the conference, tells Carbon Brief:
“A really good argument can be made that ECS should be more than 2C … I’m confident that, if the IPCC were being written today, 2C would be the bottom of the range.”
For an in-depth discussion of cloud feedbacks and climate change, there’s a good summary in Nature Geoscience by Dr Sandrine Bony from the Laboratoire de Météorologie Dynamique in Paris, one of the organisers of last week’s Ringberg conference.
‘Real world’ value
So, was it a mistake to lower the bottom boundary on climate sensitivity in the last IPCC report?
Professor Myles Allen from the University of Oxford, and lead author on the chapter dealing with climate sensitivity in the last IPCC report, doesn’t think so. He tells Carbon Brief:
“Some of the studies cited as evidence for lowering the lower bound on climate sensitivity in the last IPCC report (for example, Otto et al, on which I was a co-author), used models that were arguably too simple – but it is the job of the IPCC to reflect the literature available at the time and to be cautious in ruling out eventualities on the basis of any single line of evidence.”
Johansson, author of the new study, echoes this sentiment, telling Carbon Brief:
“Our interval for ECS of 2 to 3.2C is tighter than the interval given by the IPCC. This is expected since the IPCC base their judgement on several pieces of evidence, some of which are, at least in part, conflicting … It is the IPCC’s role to assess all available information.”
Upper limit
It also matters what the upper end of the climate sensitivity range is, arguably more so since it represents the highest risk outcome. The new paper’s approach reduces the odds that climate sensitivity is at the upper end of the IPCC’s likely range. The authors note:
“Using observations up to 2011 effectively eliminates ECS values greater than 4C (with a probability of less than 0.02% of a larger ECS value).”
Tweeting from the Ringberg conference last week (#ringberg15), Dr Tamsin Edwards, an expert in climate model uncertainty at the Open University, said the evidence “favours low to mid over high [climate sensitivity]”. In a clarifying tweet, she said that she meant “more overlap for 2-3C than say 4-5C”.
But other scientists aren’t so confident. Knutti tells Carbon Brief:
“Those [energy balance] methods assume that the feedbacks in the present day are the same as those in the future”.
There’s evidence that feedbacks depend on the climate state and increase in strength as we go towards higher temperatures, Knutti explains, with the result that climate sensitivity inferred from the observed warming is very likely too low. He says:
“If existing feedbacks change because the climate changes, or if new feedbacks like permafrost or methane hydrates become relevant, then that would not be captured by this method.”
Global permafrost distribution, defined as soil or rock that remains at or below 0C for at least two consecutive years. Source: International Permafrost Association (IPA)
As the new paper itself notes, this means the upper limit of the range is harder to determine than the lower limit and should be treated with caution.
Johansson tells Carbon Brief that while he expects natural variability will shift estimates of climate sensitivity using this method up and down in future, the “real” value probably lies in the middle of the IPCC’s likely range. This would put it around the three degree mark.
Policy impact
Climate sensitivity is a fascinating topic scientifically, and pinning it down should mean reducing uncertainty around climate projections. But the exact value has limited relevance for meeting climate targets while greenhouse emissions stay high as they are.
A 2014 paper co-authored by Knutti found that if equilibrium climate sensitivity is at the low end of the likely range, this would postpone crossing the internationally-accepted 2C temperature threshold by about a decade, assuming emissions stay close to current levels.
Other scientists argue “transient climate sensitivity” is a more policy-relevant measure. This is a simpler version of climate sensitivity that tells us what we can expect in the next few decades by ignoring parts of the climate system that change very slowly, like the oceans.
Both are measures of the climate’s sensitivity to greenhouse gases, just on different timescales. And the same rule applies to both definitions: even if the value is low, strong emissions cuts are unavoidable this century if we’re to stay below the two degree limit.
Main image: Clouds over Zakopane, Poland.
Johansson, D. J. A., et al (2015) Equilibrium climate sensitivity in light of observations over the warming hiatus. Nature Climate Change. 10.1038/nclimate2573


