Analysis: What global emissions in 2016 mean for climate change goals
Roz Pidcock
11.15.16Roz Pidcock
15.11.2016 | 1:38pmThis week, scientists from the University of East Anglia (UEA) and the Global Carbon Project released their annual stocktake of global CO2 emissions; where they come from and where they end up.
Also this week, the World Meteorological Organisation (WMO) released its “Status of the Global Climate in 2016” report, in which it made predictions for how global temperature will stack up against other years.
This is all set against the weighty backdrop of continuing talks at the COP22 international climate summit in Marrakech and falls within a week of Donald Trump being elected as the next US president.
The Global Carbon Project’s results tentatively suggest CO2 emissions from fossil fuels may be showing signs of peaking. But in this tumultuous political climate, is it a trend we’re likely to see continue?
What is happening to CO2 emissions?
The topline from the Global Carbon Project is that the amount of CO2 we put into the atmosphere from burning fossil fuels, gas flaring and cement production has held steady for three years in a row, neither increasing nor decreasing significantly.
Growth in emission is typically expressed as a percentage increase or decrease on the previous year, or compared to a specific historical period. The new analysis finds global fossil fuel emissions grew by 0.7% in 2014, then held steady in 2015. Provisional data for 2016 predict a very small rise, of just 0.2%.
This is a notable slowdown in emission growth, compared to an average rate of 3.5% in the 2000s and 1.8% over the most recent decade, 2006-2015. You can see this in the top left panel below.
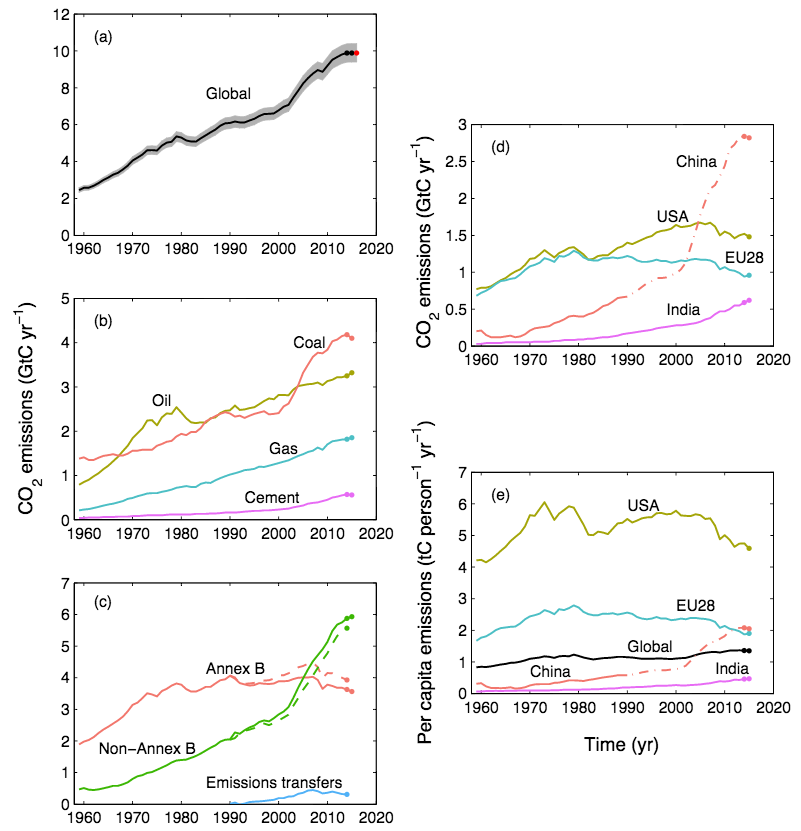
Global CO2 emissions from fossil fuel and industry since 1960 (top left); global emissions by fuel type (middle left); Territorial (solid) and consumption (dashed) emissions by country group (bottom left); territorial emissions from biggest emitters (top right); per capita emissions from biggest emitters (bottom right). Source: Le Quéré, C. et al. (2016)
But as long as we’re emitting CO2, it continues to build up in the atmosphere – and it is doing so at record levels. As Prof Richard Betts explained in his guest post for Carbon Brief last week, 2016 will be the first full year in which atmospheric CO2 concentration stays above the 400 ppm milestone.
Rising concentrations mean rising temperatures. The WMO has confirmed that 2011-2015 was the hottest five-year period on record and it expects 2016 to be the hotter, beating 2015 into second place with a global average temperature of 1.2C above the long-term average. This will mean 16 of the 17 warmest years on record will have been since 2000.
Where are our emissions coming from?
Averaged over the last decade, emissions from fossil fuels and industry account for 91% of human-caused CO2 emissions, with 9% coming from land use change.
Of the 9.9bn tonnes of carbon in the form of CO2 emitted from fossil fuels in 2015, 41% came from coal, 34% from oil, 19% from gas, 5.6% from cement production and 0.7% from flaring.
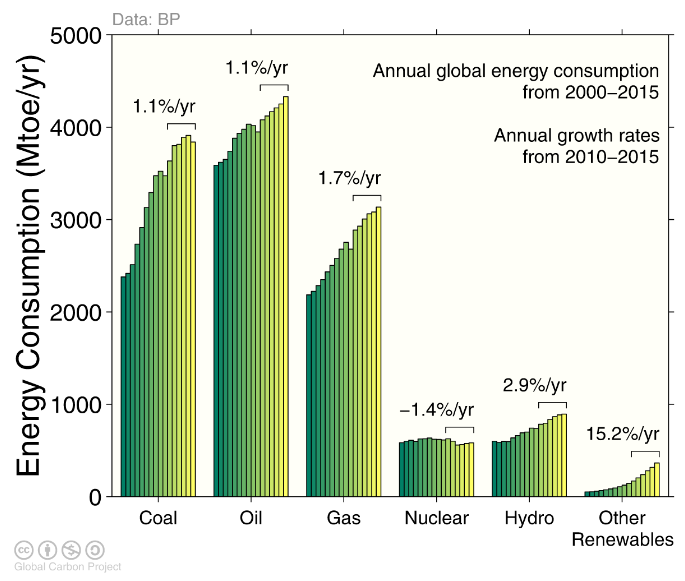
Energy consumption by fuel source from 2000 to 2015, with growth rates indicated for the more recent period of 2010 to 2015. Source: BP 2016; Jackson et al 2015; Global Carbon Budget 2016
For the period 2010-2015, energy from renewable sources grew by 15.2% per year, compared to 1.7% per year for gas and 1.1% per year for both oil and coal, as you can see in the graph above.
Not all CO2 emissions stay in the atmosphere. Plants on land and the oceans absorb CO2, reducing the amount of warming we experience. Of the total CO2 emissions in 2015, 44% stayed in the atmosphere (light blue below), plants absorbed 31% (green) and the oceans 26% (dark blue).
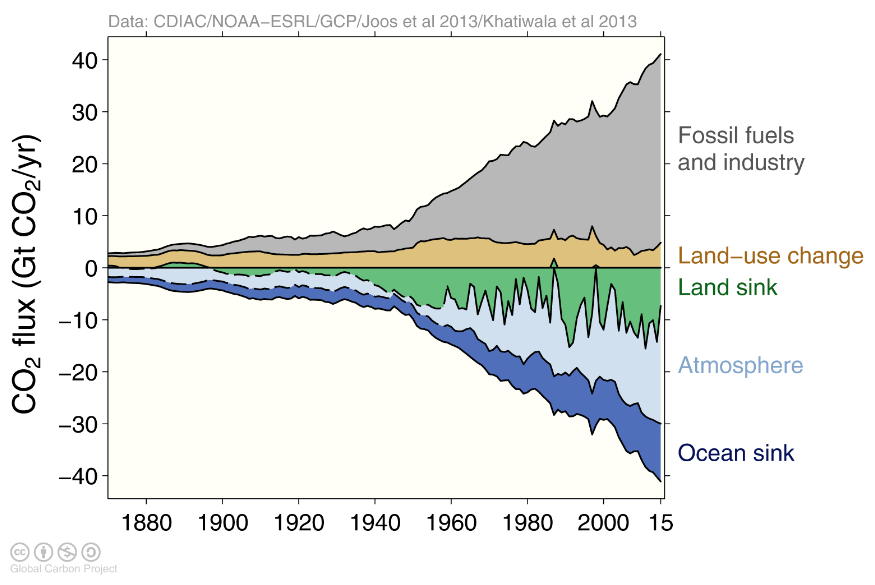
Human-caused sources of CO2 over time (fossil fuels/industry and land use change) sinks of CO2 (land plants, oceans and the atmosphere) All figures are in billions of tonnes of carbon per year (GtC / yr). Source: Le Quéré, C. et al. (2016)
Have global CO2 emissions peaked?
Three years with very little growth in fossil fuel emissions have raised hopes that we’re seeing a peak. But scientists are being cautious about overinterpreting a few years of data. Dr Glen Peters, senior researcher at the Centre for International Climate and Environmental Research in Oslo (CICERO) and project manager of the Global Carbon Project, tells Carbon Brief:
“Emissions have levelled out, but it’s too early to say whether that’s a peak in global emissions. First of all, we’d need to see emissions going down…Then after that, we’d need several years, maybe even a decade, to be confident that it was actually a peak.”
First things first, we need to first see where the final figure for 2016 ends up. The scientists’ central projection is for a 0.2% rise, but uncertainties inherent in these kind of carbon budget calculations means fossil fuel emissions could fall by as much as 1%, or rise by up to 1.8%. There’s even a 32% chance the figure could be outside both of these limits, say the scientists.
Should it turn out that fossil fuel emissions have stabilised in 2014-16, it’s notable that they will have done so at the same time that the world economy has been growing at more than 3% per year, say the authors.
What are individual countries doing?
The main reason for the recent slowdown in global emissions is changing energy use in China, say the researchers. In 2015, China’s domestic emissions dropped by 0.7% and are expected to fall a further 0.5% in 2016. This is compared to an average rise of 5% per year over the previous ten-year period.
China is the world’s biggest emitter, responsible for 29% of global emissions in 2015. Any halt in China’s meteoric rise in CO2 emissions since the early 2000s is, therefore, likely to have global consequences.
The drop in emissions forecast for China in 2016 is largely down to a reduction in coal emissions of 1.8%, though this will be partly offset by a growth in emissions from oil of 4%, from natural gas of 7.2% and from cement production of 2.6%, provisional figures for January to September suggest.
Despite stable emissions in the past few years, China still emitted almost twice as much CO2 in 2015 as the next biggest emitter, the United States. You can see how the two countries’ emissions profile compare in the graphs below.
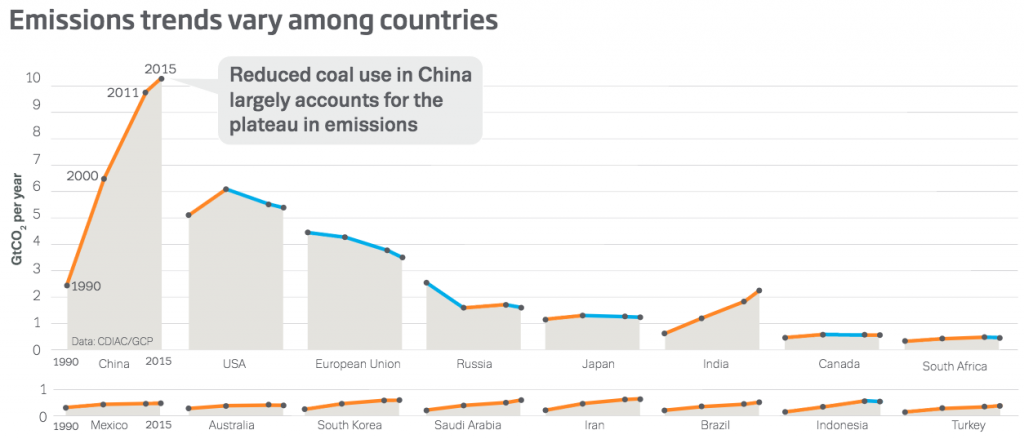
Emissions trends in different countries from 1990-2015. Orange lines indicate growth, blue indicates reductions. Source: Le Quéré, C. et al. (2016)
As the second biggest emitter, the US is responsible for 15% of global emissions in 2015. Burning more oil and gas, but less coal, saw the US’s emissions fall 2.6% in 2015 and they are projected to fall a further 1.7% in 2016.
But events over the past week have thrown some uncertainty over whether or not this trend will continue, Peters tells Carbon Brief:
“US emissions have been going down for about a decade. But even then, it’s a little bit early to say with confidence that it has peaked and maybe the Trump presidency would lead to an increase in emissions.”
The EU’s emissions rose by 1.4% in 2015, despite having declined over the long term. The bloc is the world’s third largest emitter, responsible for 10% of global CO2 emissions in 2015. Peters tells Carbon Brief:
“EU emissions have been basically going down for two decades, so we can comfortably say it has peaked.”
In contrast, emissions are rising across the developing world. India, which contributes 6.3% of global emissions, saw its emissions rise by 5.2% in 2015.
Can we still limit warming to 2C?
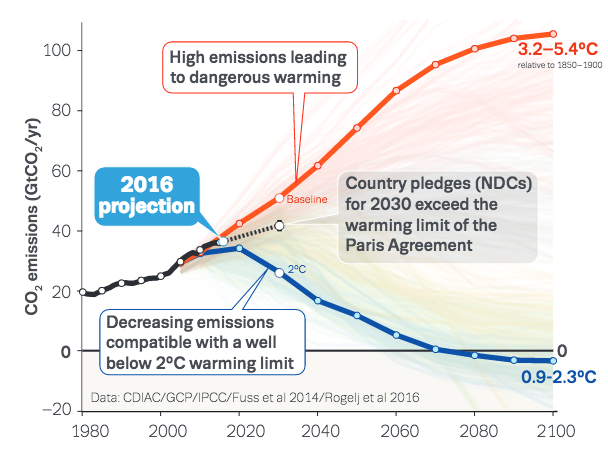
If it turns out that fossil fuel emissions have peaked, this would spell good news for international climate targets as it suggests countries are on track to meet their national commitments under the Paris Agreement (dashed line in the graph below).
But as the blue line shows, emissions reductions will need to pick up momentum everywhere to meet the goal of limiting warming to the internationally agreed goal of staying “well below” 2C above pre-industrial levels.
 here." width="608" height="460" srcset="https://www.carbonbrief.org/wp-content/uploads/2016/11/GlobalCarbonBudget_5.png 608w, https://www.carbonbrief.org/wp-content/uploads/2016/11/GlobalCarbonBudget_5-300x227.png 300w" sizes="(max-width: 608px) 100vw, 608px" />
Global CO2 emissions since 1980 (solid black) and country pledges under the Paris Agreement (dashed) compared to a high emissions scenario (orange) and a scenario compatible with limiting warming to 2C above pre-industrial levels (blue). Source: data from Le Quéré, C. et al. (2016) based on Rogelj et al, (2016); infographic can be found here.
If the world pursues the Paris Agreement’s more ambitious limit of 1.5C, the timescales over which global emissions need to peak and start falling rapidly are much shorter. By the end of 2016, total global emissions since the start of the industrial era will total 565bn tonnes of carbon – or 92% of the carbon budget for 1.5C.
Expressed a different way, there are just over four years’ worth of current emissions left before it becomes unlikely that we’ll meet the 1.5C target without overshooting and relying on unproven “negative emissions” technologies to remove large amounts of CO2 out of the air later in the century.
New analysis from Climate Dynamics this week finds that to keep warming well below 2C and to pursue efforts to limit it to 1.5C in the most cost-effective way, rich countries must phase out coal-fired electricity by 2030, China by 2040 and the rest of the world by mid-century. Not doing so increases our reliance on far more costly and, as yet, unproven negative emissions technologies in the second half of the century, the researchers explain.
It remains to be seen whether or not key countries’ energy and climate policies in the near future lock them into further emissions rises or build momentum for further cuts. With coal emissions a good signal of which direction things are going in, addressing emissions growth over the next few years will be instrumental in how realistic our collective chances are for staying on track to meet climate targets in the longer term.
Source: Le Quéré, C. et al. (2016) Global carbon budget 2016. Earth System Science Data. DOI: 10.5194/essd-8-1-2016

